线性二次调节器
问题描述
线性二次调节器(Linear Quadratic Regulator, LQR)是最经典的最优控制问题之一。本节通过求解最基本的 LQR 问题展示 pockit 的使用方法。
系统仅包含一个阶段。有 \(n_x = 1\) 个状态变量 \(x\) 和 \(n_u = 1\) 个控制变量 \(u\)。动力学方程为
$$ \dot x = ax + bu $$
其中 \(a = -1, b = 1\) 为给定的参数。 有单个积分
$$ \mathbb{I} = \int_{t_0}^{t_f} \left( q x^2 + r u^2 \right) \mathrm dt $$
参数 \(q = 1, r = 0.1\)。 阶段的时间区间固定为 \(t_0 = 0, t_f = 1\),有边界条件
$$ x_0 = 1, x_f = \text{free} $$
在系统层面,有目标函数
$$ F = \mathbb I + \frac{s x_f^2}{2} $$
参数 \(s = 1\)。
计算程序
from pockit.lobatto import System, constant_guess
from pockit.optimizer import ipopt
import matplotlib.pyplot as plt
# LQR problem:
# min ∫_0^1 (q * x^2 + r * u^2) dt + s * x_f^2 / 2
# s.t. x' = a * x + b * u, x(0) = 1
# Set parameters
a, b, s, q, r = -1, 1, 1, 1, 0.1
# Set up the system
system = System(["x_f"]) # the system has one free parameter x_f
x_f, = system.s # extract the Sympy symbol x_f
phase = system.new_phase(["x"], ["u"]) # the phase has one state x and one control u
x, = phase.x # extract the Sympy symbol x
u, = phase.u # extract the Sympy symbol u
phase.set_dynamics([a * x + b * u]) # x' = a * x + b * u
phase.set_integral([q * x ** 2 + r * u ** 2]) # I = ∫ q * x^2 + r * u^2 dt
phase.set_boundary_condition([1], [x_f], 0, 1) # x(0) = 1, x(t_f) = x_f, t_0 = 0, t_f = 1
phase.set_discretization(10, 10) # 10 subintervals with 10 collocation points in each subinterval
system.set_phase([phase]) # bind the phase to the system
system.set_objective(phase.I[0] + s * x_f ** 2 / 2) # define the objective function
# Solve the problem
guess_p = constant_guess(phase, 0) # initial guess for the phase
guess_s = [0.] # initial guess for the free parameter x_f
# var_p, var_s: the optimal solution for the phase and the free parameter
[var_p, var_s], info = ipopt.solve(system, [guess_p, guess_s])
# Print the results
print("status:", info["status_msg"].decode())
print("objective:", info["obj_val"]) # 0.2319139744522318
# Plot the results
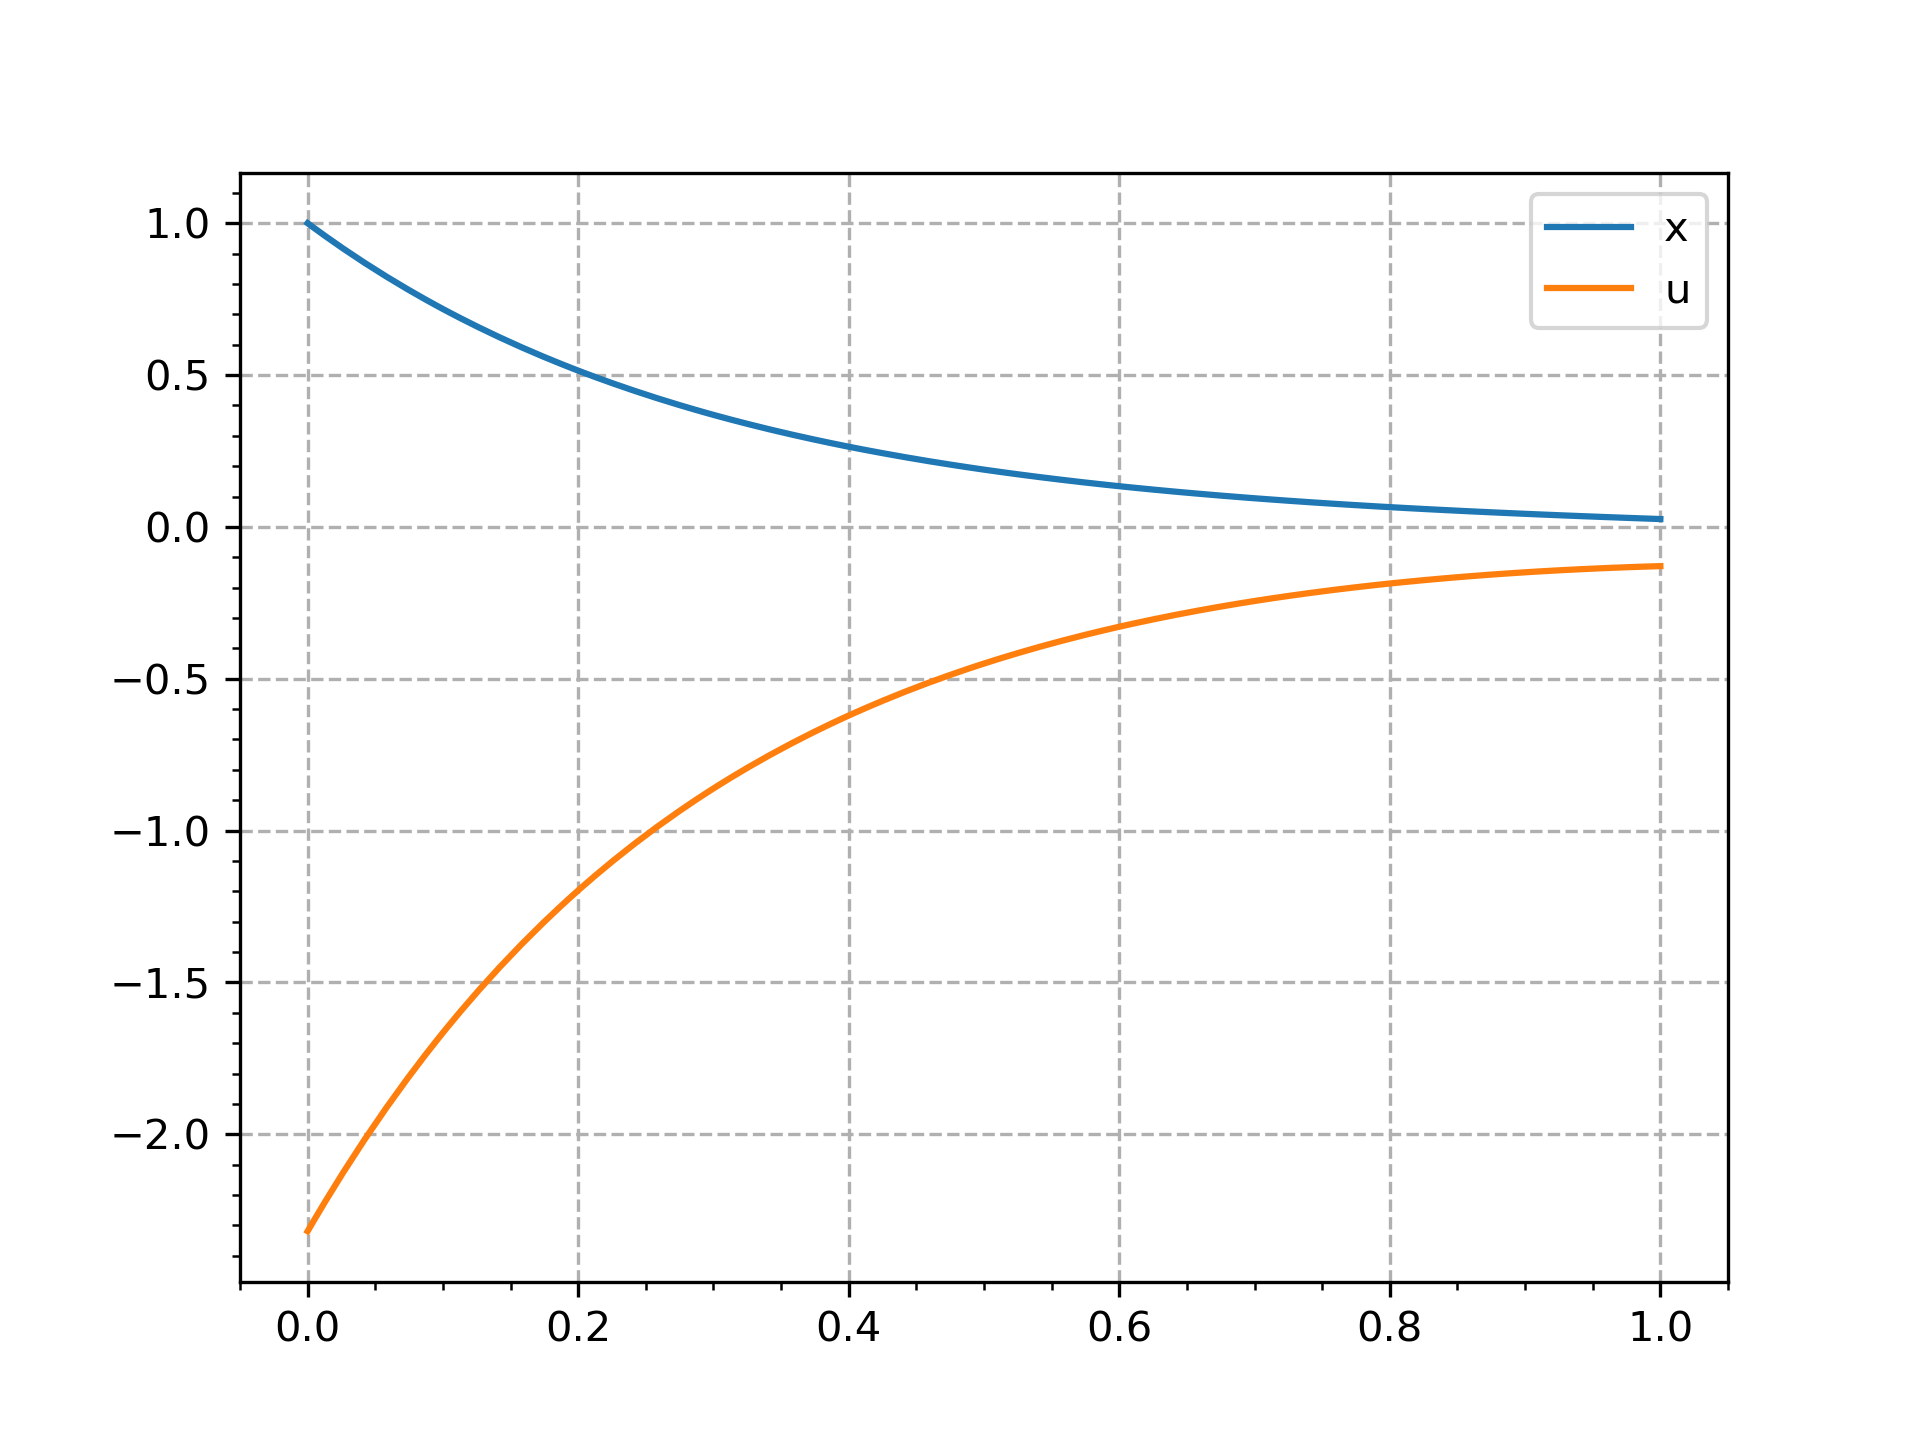
plt.plot(var_p.t_x, var_p.x[0], label="x") # only one state variable and one control variable,
plt.plot(var_p.t_u, var_p.u[0], label="u") # so the indices are 0 for both
plt.legend()
plt.minorticks_on()
plt.grid(linestyle='--')
plt.show()
计算结果