Capacity-Constrained SIR Epidemic Intervention
Background
An epidemic-control policy must balance two competing effects: reducing infectious contacts limits illness, but sustained restrictions are costly. The susceptible-infected-removed (SIR) model is a compact way to study that tradeoff. This example adds a hard upper bound on the infected population, representing a health-care capacity that the optimized trajectory must never exceed.
This is an illustrative control model, not a forecasting or public-health decision tool.
Problem formulation
Let \(S(t)\), \(I(t)\), and \(R(t)\) be population fractions and let \(u(t)\) be the fractional reduction in potentially infectious contacts. The controlled SIR dynamics are
with \(\beta=0.32\ \mathrm{day}^{-1}\), \(\gamma=0.10\ \mathrm{day}^{-1}\), and initial condition
Over the fixed 100-day horizon, the objective is
The first term penalizes infection burden; the second penalizes intervention effort. The path constraints are
Because the three derivatives sum to zero and the initial fractions sum to one, \(S+I+R=1\) throughout the trajectory.
Variables and units
| Symbol | Meaning | Unit |
|---|---|---|
| \(t\) | Time | day |
| \(S,I,R\) | Susceptible, infected, and removed fractions | - |
| \(u\) | Fractional contact reduction | - |
| \(\beta\) | Baseline transmission rate | day\(^{-1}\) |
| \(\gamma\) | Removal rate | day\(^{-1}\) |
Modeling choices
The problem uses one fixed-time Lobatto phase with 80 mesh intervals and two interpolation points per interval. Both the intervention limit and capacity limit are imposed as path constraints. Because the reconstructed state and control are piecewise linear, their nodal bounds hold throughout each interval. The terminal population is free: the optimizer chooses it indirectly through the dynamics and the running cost. A separate 4,001-point check validates the reconstructed path and population conservation after optimization.
The effort weight is chosen so that capacity is genuinely relevant. A much smaller weight would suppress infection far below the limit and would fail to demonstrate an active path constraint.
Run the example
From the repository root:
Save the figure without opening a window:
Key implementation
system = System(0)
phase = system.new_phase(
    ["susceptible", "infected", "removed"], ["intervention"]
)
susceptible, infected, _ = phase.x
(intervention,) = phase.u

incidence = BETA * (1 - intervention) * susceptible * infected
phase.set_dynamics([-incidence, incidence - GAMMA * infected,
                    GAMMA * infected])
phase.set_integral([infected**2 + EFFORT_WEIGHT * intervention**2])
phase.set_phase_constraint(
    [intervention, infected], [0.0, 0.0], [INTERVENTION_MAX, CAPACITY]
)
phase.set_boundary_condition([0.99, 0.01, 0.0], [None] * 3,
                             0.0, HORIZON)
system.set_phase([phase])
system.set_objective(phase.I[0])
Verified result
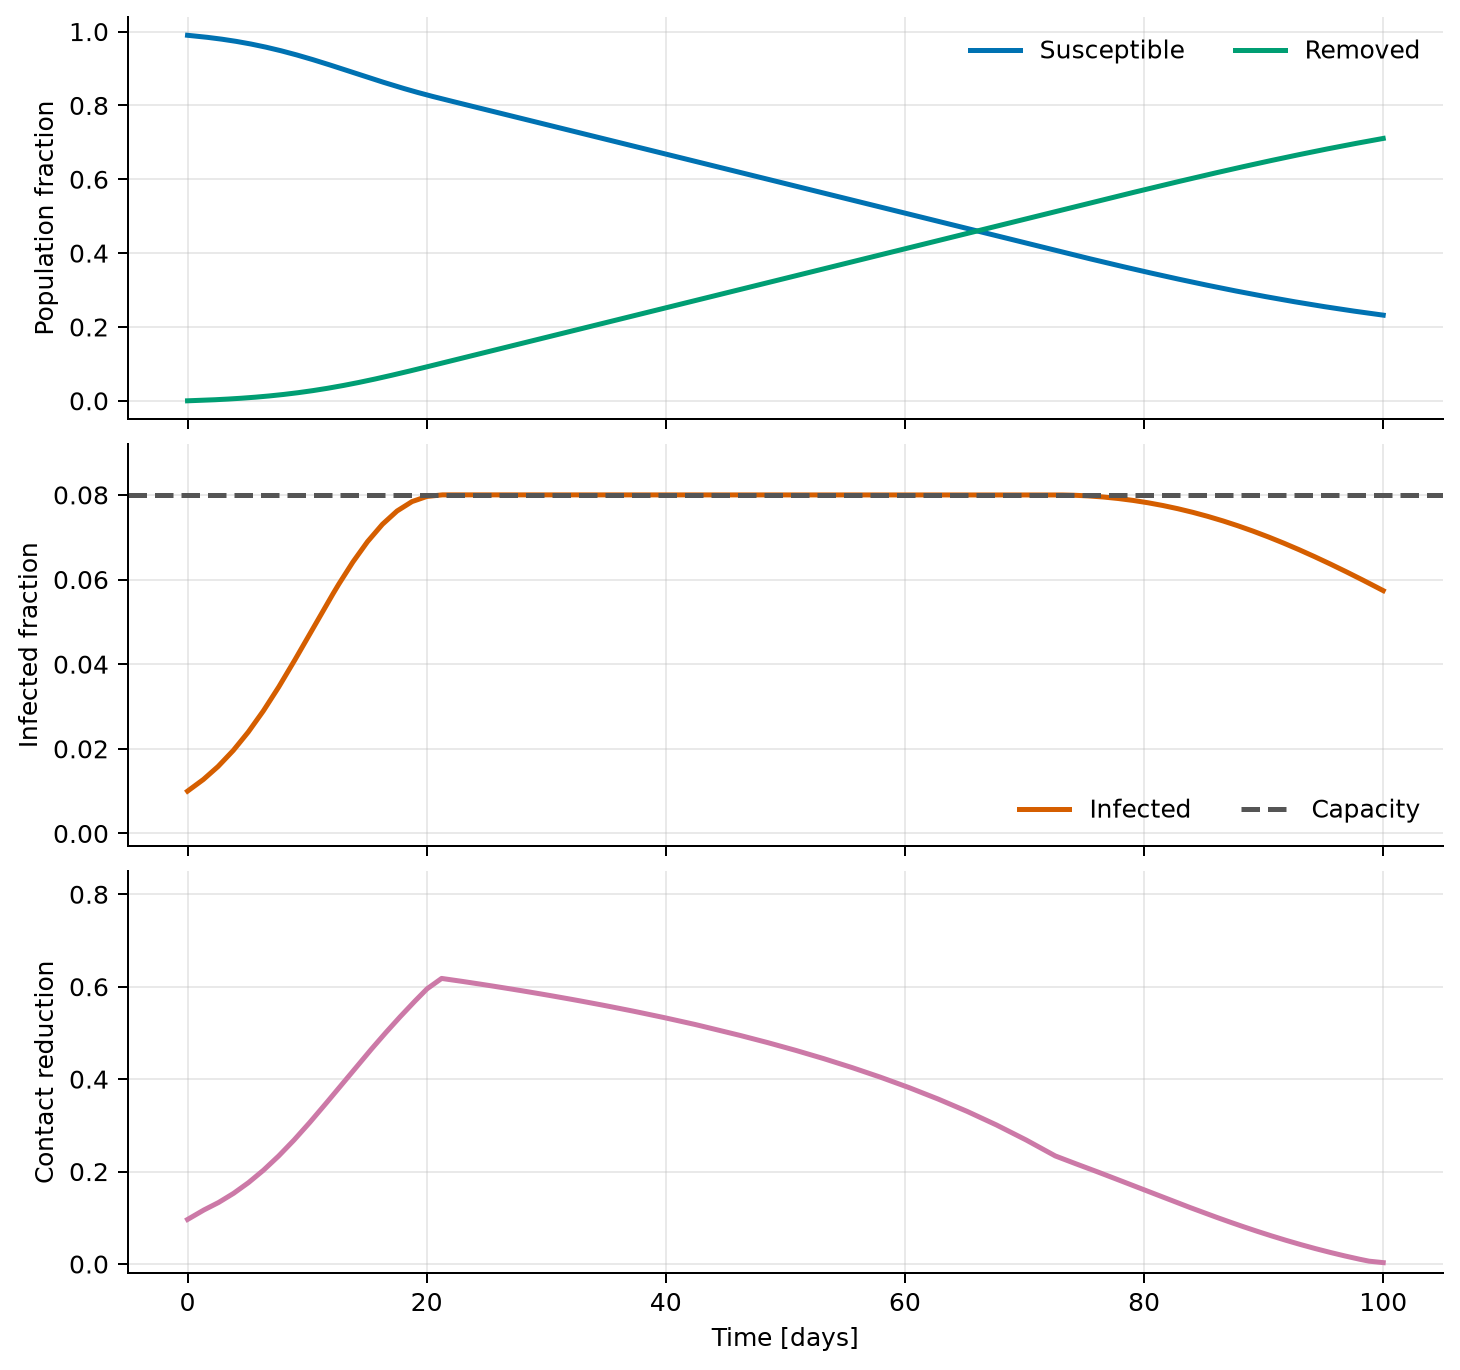
Ipopt terminates successfully with objective \(J=1.29856860\). The dense-grid peak infected fraction is \(0.080000\); its \(7.375\times10^{-11}\) excess over the capacity bound is within the solver tolerance. The optimal policy initially allows infections to rise, then varies contact reduction to hold the infected fraction close to capacity before relaxing the intervention. The final removed fraction is \(0.710622\), and the maximum population-conservation error is below \(3\times10^{-16}\).
Source code
See the complete runnable example: examples/sir_epidemic_control.py.